 Lake Huron Weather

Wind Trends as of 25-Jul-2026 at 3:10pm
( Note: Only the 'Current' values may be updated in near-realtime, while the other values are current when the page is loaded. The other data was from 25-Jul-2026 3:10pm. Reload this page for updated data.)
Latest Wind Data
| CURRENT |
|
|
| Now | 0.9 mph SE | |
| Gust | 0.0 mph SE | |
| Gust/hr | 7.0 mph | |
| WIND GUST HIGHS | ||
| Today | 8.1 mph SSE at 12:40pm | |
| Yest. | 10.4 mph at 1:26pm | |
| Month | 41.0 mph on 23-Jul-2026 | |
| Year | 53.0 mph on 11-Feb-2026 | |
| WIND GUST AVERAGE HIGHS | ||
| Today | 4.2 mph SSW at 12:41pm | |
| Yest. | 4.6 mph at 1:27pm | |
| Month | 16.7 mph on 23-Jul-2026 | |
| Year | 17.7 mph on 16-Mar-2026 | |
| WIND RUN | ||
| Today | 26.07 miles | |
| Month | 737.59 miles | |
| Year | 12528.69 miles | |
Wind run is a measurement of how much wind has passed a given point during a given period of time. A wind blowing at five miles per hour for an entire day (24 hours) would give a wind run of 120 miles for the day.
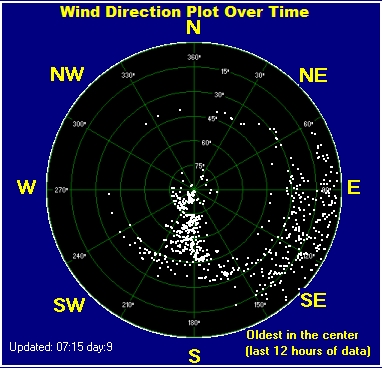
Wind Trend Graphs
Graphs generated by Virtual Weather Station (V15.00)


